With more information than ever at our fingertips, statisticians are vital to innumerable fields and industries. Welcome to the world of the datarati, where humans and machines team up to crunch the numbers.
It fills hard drives, but to extract value from it, we need methods that learn patterns in the data and allow us to make predictions and intelligent decisions.
Professor Zoubin Ghahramani
“I keep saying that the sexy job in the next 10 years will be statisticians, and I’m not kidding,” Hal Varian, Chief Economist at Google famously observed in 2009. It seems a difficult assertion to take seriously, but six years on, there is little question that their skills are at a premium.
Indeed, we may need statisticians now more than at any time in our history. Even compared with a decade ago, we can now gather, produce and consume unimaginably large quantities of information. As Varian predicted, statisticians who can crunch these numbers are all the rage. A new discipline, ‘Data Science’, which fuses statistics and computational work, has emerged.
“People are awash in data,” reflects Zoubin Ghahramani, Professor of Information Engineering in the Computational and Biological Learning Laboratory. “This is occurring across industry, it’s changing society as we become more digitally connected, and it’s true of the sciences as well, where fields like biology and astronomy generate vast amounts of data.”
Over the past few years, Richard Samworth, Professor of Statistics at Cambridge, has watched the datarati step out from the shadows. “It’s probably fair to say that statistics didn’t have the world’s best PR for quite a long time,” he says. “Since this explosion in the amount of data that we can collect and store, opportunities have arisen to answer questions we previously had no hope of being able to address. These demand an awful lot of new statistical techniques.”
‘Big data’ is most obviously relevant to the sciences, where large volumes of information are gathered to answer questions in fields such as genetics, astronomy and particle physics, but it also has more familiar applications. Transport authorities gather data from electronic ticketing systems like Oyster cards to understand more about passenger movements; supermarkets closely monitor customer transactions to react to shoppers’ predilections. As users of social media, many of us disclose data about ourselves that is as valuable to marketing as it is relevant to psychoanalytics. Increasingly, we are also ‘lifeloggers’, monitoring our own behaviour, health, diet and fitness, through smart technology.
This information, as Professor Ghahramani points out, is no use on its own: “It fills hard drives, but to extract value from it, we need methods that learn patterns in the data and allow us to make predictions and intelligent decisions.” This is what statisticians, computer scientists and machine learning specialists bring to the party – they build algorithms, which are coded as computer software, to see patterns. At root, the datarati are interpreters.
Despite their ‘sexy’ new image, however, not enough data scientists exist to meet this rocketing demand. Could some aspects of the interpretation be automated using artificial intelligence instead, Professor Ghahramani wondered? And so, in 2014 and with funding from Google, the first incarnation of The Automatic Statistician was launched online. Despite minimal publicity, 3,000 users uploaded datasets to it within a few months.
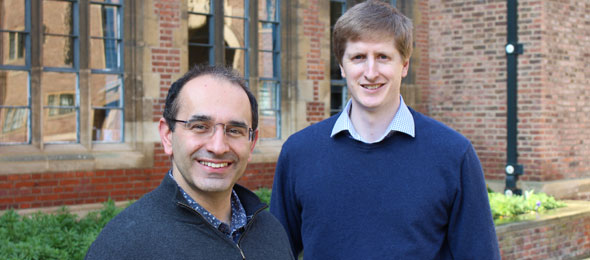
Professor Zoubin Ghahramani, left, and Professor Richard Samworth
Once fed a dataset, the Automatic Statistician assesses it against various statistical models, interprets the data and – uniquely – translates this interpretation into a short report of readable English. It does this without human intervention, drawing on an open-ended ‘grammar’ of statistical models. It is also deliberately conservative, only basing its assessments on sound statistical methodology, and even critiquing its own approach.
Professor Ghahramani and his team are now refining the system to cope with the messy, incomplete nature of real-world data, and also plan to develop its base of knowledge and to offer interactive reports. In the longer term, they hope that the Automatic Statistician will learn from its own work: “The idea is that it will look at a new dataset and say, ‘Ah, I’ve seen this kind of thing before, so maybe I should check the model I used last time’,” he explains.
While automated systems rely on existing models, new algorithms are needed to extract useful information from evolving and expanding datasets. Here, the role of human statisticians is vital.
To characterise the problem, Professor Samworth presents a then-and-now comparison. During the past century, a typical statistical problem might, for instance, have been to understand the relationship between the initial speed and stopping distance of cars based on a sample size of 50.
These days, however, we can record information on a huge number of variables at once – the weather, road surface, make of car, wind direction, and so on. Although the extra information has the potential to yield better models and reduce uncertainty, in many areas, the number of features measured is so high it may even exceed the number of observations. Identifying appropriate models in this context is a serious challenge, which requires the development of new algorithms.
To resolve this, statisticians rely on a principle called ‘sparsity’; the idea that only a few bits of the dataset are really important. The statistician identifies these needles in the haystack. Various algorithms have been developed to select the important variables, so that the initial sprawl of information starts to become manageable and patterns can be extracted.
Together with his colleague Dr Rajen Shah in the Department of Pure Mathematics and Mathematical Statistics, Professor Samworth has developed a method for refining any such variable selection technique called ‘Complementary Pairs Stability Selection’. This applies the original method to random subsamples of the data instead of the whole, and does this over and over again. Eventually, the variables that appear on a high proportion of the subsamples emerge as those meriting further attention.
Scanning Google Scholar for citations of the paper in which this was proposed, Professor Samworth finds that his algorithm has been used in numerous research projects. One looks at how to improve fundraising for disaster zones, another examines potential biomarkers for breast cancer survival, and a third identifies risk factors connected with childhood malnutrition.
How does he feel when he sees his work being applied so far and wide? “It’s funny,” he says. “My training is in mathematics and I still get a kick from proving a theorem, but it’s also rewarding to see people using your work. It’s often said that the good thing about being a statistician is that you get to play in everyone’s back yard. I suppose this demonstrates why that’s true.”
This article originally appeared on the University of Cambridge website.
