Students from the Integrated Multimodal Pattern Analysis for Climate Transformation Research Group volunteered to offer their skills in geospatial data, remote sensing, web map visualisation, and image signal processing to understand the earthquake impacts in Myanmar and Thailand.
This exercise was a good piece of work for everyone to really understand some of these technical challenges that we have in this kind of space.
Dr. Sakthy Selvakumaran, who co-leads the IMPACT Research Group
Introduction
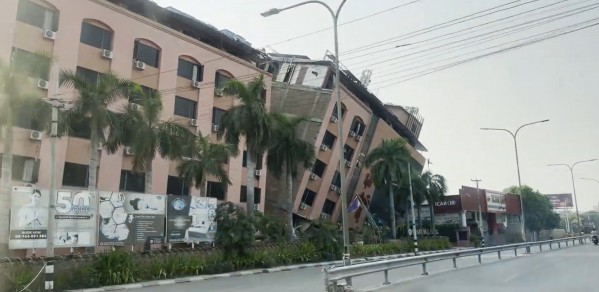
On March 28, 2025, a powerful magnitude 7.7 earthquake struck central Myanmar near Mandalay, causing widespread devastation. The earthquake resulted in over 3,600 deaths, injured more than 5,000 people, and left approximately 200,000 homeless. In the aftermath, near-real-time maps have become crucial tools, utilising various satellite imagery, remote sensing, and geospatial data to rapidly identify and assess affected areas. These maps enable responders to prioritise resources effectively, facilitating efficient disaster response and recovery efforts.
A Science-to-Action Window
That same day, about 12 hours after the earthquake and 6 hours after their fortnightly research group meeting, students from Civil Engineering’s Integrated Multimodal Pattern Analysis for Climate Transformation (IMPACT) Research Group joined together as a group of twelve volunteers to offer their skills in geospatial data, remote sensing, web map visualisation, and image signal processing to understand the earthquake impacts in Myanmar and Thailand.
Under the coordination of Joshua Dimasaka, the group began monitoring, acquiring, and processing pre- and post-event satellite images, such as the publicly available Sentinel-1 synthetic aperture radar (SAR) data and different high-resolution multi-spectral RGB data, capturing possibly significant changes on the map. These changes in reflection from buildings after the earthquake could be attributed to physical damage to the buildings and other environmental noises.
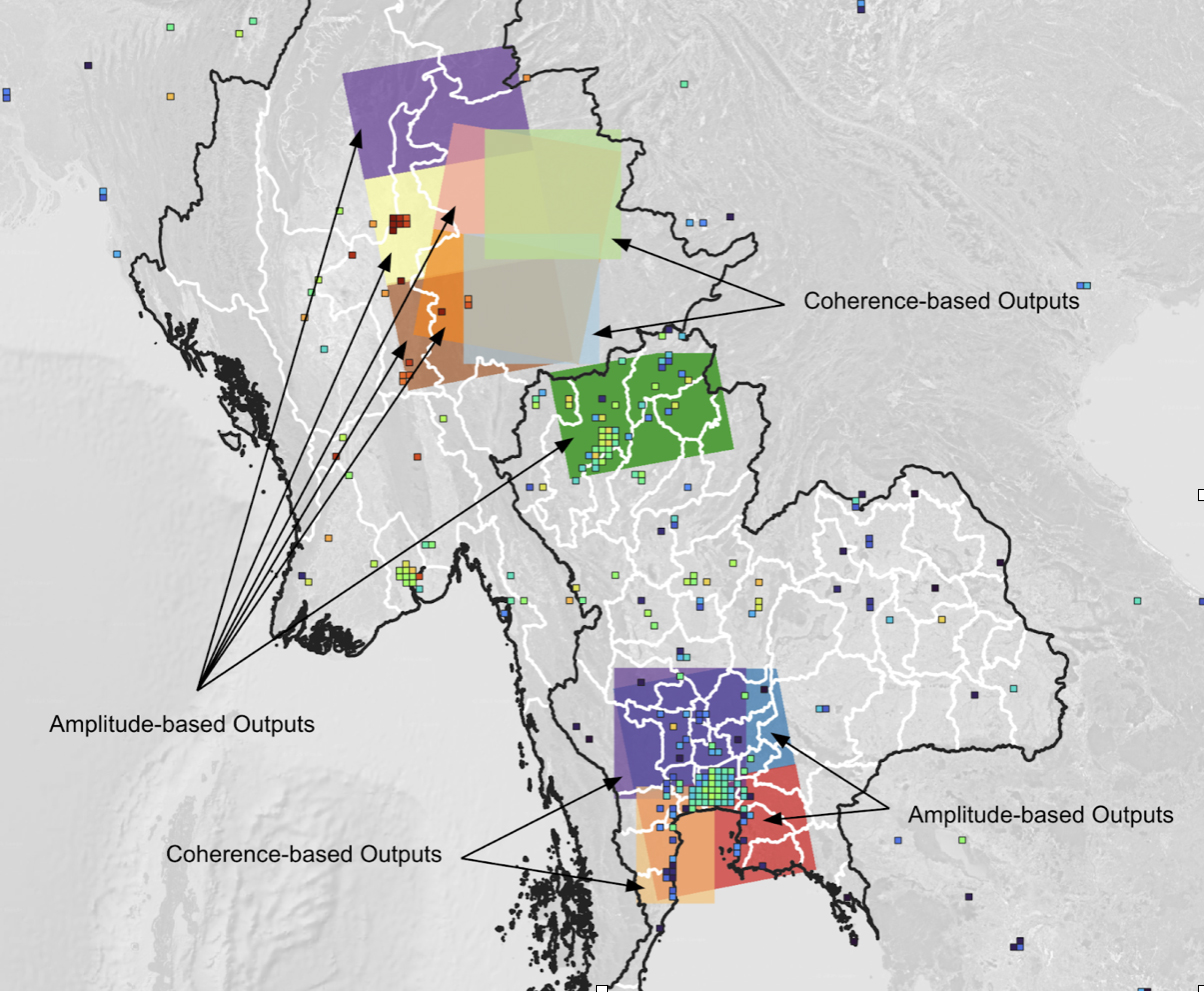
Image above: Areas of interest where publicly available Sentinel-1 SAR satellite images are available. The arrows specify which of the two types of signal processing analysis was performed. The coloured grids display the density of the “Did You Feel It?” reports from the U.S. Geological Survey. © Google for the grayscale background image.
To quantify these changes, Shagun Garg, Wanli Ma, Lisanne Blok, Lorenzo de Nava, and Joshua Dimasaka worked together to use and test several signal processing methods, including coherence-based methods and different amplitude-based detection algorithms.
To evaluate these signal processing methods and to identify buildings with significant changes, Grace Beaney-Colverd helped by gathering various large datasets with 23 million building footprints from OpenStreetMap, Google Open Buildings V3, Microsoft Bing, and Overture Maps Foundation, in addition to some machine-learning-derived built-area datasets like Dynamic World V1 and and Google Open Buildings 2.5D Temporal.
To validate these maps, Lisanne Blok and Dr. Maria Fernanda Lammoglia Cobo made efforts to gather and translate reported information on collapsed buildings from Bangkok’s government websites, as well as news articles. While the group acknowledges some technical challenges such as uncertainty and reliability due to the limited ground validation and their constrained volunteering capacity, their outputs still offer an insight into how the signals of satellite imagery changed on the ground, combined with a variety of relevant datasets of the built environment.
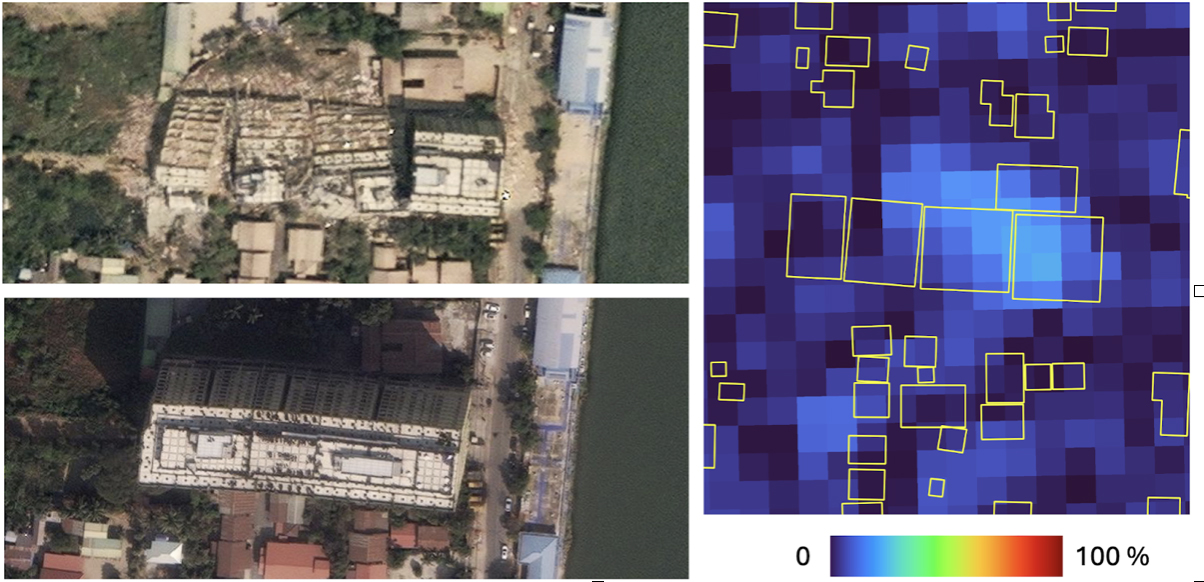
Image above: High-resolution satellite imagery (left) and a normalised signal change map (right) with building polygons showing Sky Villa Condo in Mandalay, Myanmar, before (February 15, 2025) and after (March 31, 2025) the earthquake. Coordinates: 21°59'09.0"N 96°06'59.5"E. Source: MAXAR’s Open Data Program.
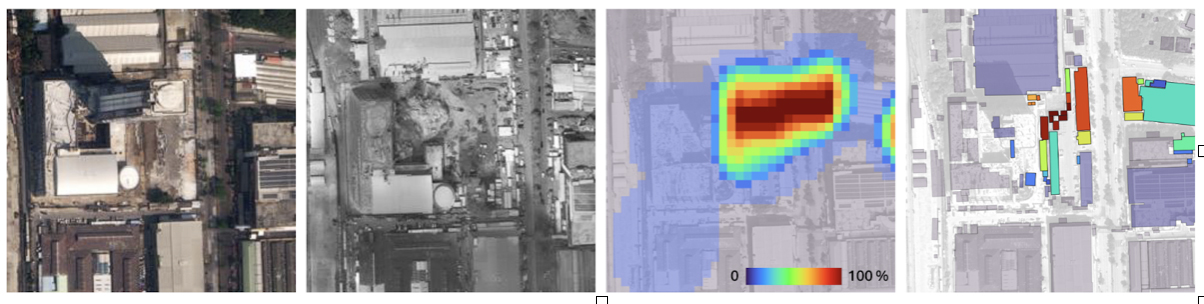
Image above: Pre- and post-earthquake high-resolution satellite images, a map of signal change, and a map of building footprints with tagged information on signal changes (from left to right) for State Audit Office, Bangkok, Thailand, before (February 14, 2025) and after (April 4, 2025) the earthquake. Coordinates: 13°48'08.7"N 100°32'49.0"E. Source: MAXAR’s Open Data Program, Google for the grayscale background image.
To publicly share the outputs of the group, Han Ding, Orlando Timmerman, and Grace Beaney-Colverd developed a web map visualisation dashboard and Shaomin Guo organised all collected data and post-processed outputs in an publicly accessible Zenodo record.
Educational Opportunity
Despite numerous challenges such as incomplete ground validation, low-quality building footprint data in Myanmar, and large data requirements, this three-week-long voluntary project has transformed into a rich and unique educational opportunity with practical insights into how satellite imagery can be used for public good and urgent humanitarian missions, extending beyond what students can learn, in contrast to the more relaxed and traditional classroom setting where all data and tools are already provided.
April 11th, two weeks after the earthquake, the volunteers from the IMPACT Research Group gathered again to reflect on the lessons they had learnt. Lisanne Blok, who investigated thousands of incident reports, emphasised that “it was hard to distinguish between actual damage and small cosmetic damage.” She added that, in developing a robust data-driven model for rapid assessment of building damage, one must consider “many assumptions to make it useful.” Joshua Dimasaka also supported Lisanne Blok’s observation, leaving a question to the group: “is [the degree of building damage] really visible on the satellite imagery?”
Grace Beaney-Colverd highlighted a key challenge of the varying data release times and satellite pass-overs. Wanli Ma and Joshua Dimasaka noted that the raw satellite data was missing key information, like a coordinate reference system. Shagun Garg and Wanli Ma, who both worked on the coherence of pre- and post-event satellite images, also observed other missing information like the orbit file, a reference which is necessary for aligning these two images.
Shagun Garg pointed out that “this is also [an active] research area that people are doing”. As he has been doing some research on this, he added that researchers “are trying to find some data from around the world to train a large model and then use it for rapid response after [disaster] events.”
Joshua Dimasaka concluded that he was “happy to see that there are people in the university who are willing to volunteer. We just need someone who will convene this kind of effort.” However, he also added “everyone has their own responsibilities in the university, and we may or may not give a nice result, and that's okay; but this has become a good exercise for everybody to witness what it's like in this very unique setting, very urgent, no data availability, and any other problems that we may have.”
Dr. Sakthy Selvakumaran, who co-leads the IMPACT Research Group with Dr. Andrea Marinoni, expressed her appreciation that “This exercise was a good piece of work for everyone to really understand some of these technical challenges that we have in this kind of space.”
Further work
As this activity has enabled the appreciation of the value of uncertainty of satellite-derived products and their cascading effects, the group is also potentially extending this work with Dr. Sakthy Selvakumaran and Wanli Ma. Any future inquiries on this project can be forwarded to them.
Volunteers
- Joshua Dimasaka 2nd-year PhD student in CDT AI for Environmental Risks
- Shagun Garg 2nd-year PhD student in CDT Future Infrastructure and Built Environment, Engineering
- Wanli Ma, Research Assistant, Engineering
- Lisanne Blok, 2nd-year PhD student in CDT AI for Environmental Risks, Earth Sciences
- Lorenzo de Nava, Post-Doctoral Researcher, Earth Sciences
- Grace Beaney-Colverd, 3rd-year PhD student in CDT in AI for Environmental Risks, Engineering
- Dr. Maria Fernanda Lammoglia Cobo, Research Associate, Centre for Risk Studies
- Han Ding, 2nd-year PhD student in CDT Future Infrastructure and Built Environment, Engineering
- Orlando Timmerman, 2nd-year PhD student in CDT AI for Environmental Risks, Earth Sciences
- Shaomin Guo, Visiting Student, Engineering
- Dr. Sakthy Selvakumaran, Engineering
- Dr. Andrea Marinoni, Computer Science
